The irrigation capacity of a system is the amount of water it can make available to the crop each day, after losses; it is expressed in mm of water per day. The calculator below lets you estimate it from the flow rate of your pump or of your emitters, micro-sprinklers or sprinklers, the irrigation time available each day, the days of access to water and the application efficiency of your irrigation method, then compares it with your crop’s peak ETc. It also converts an irrigation depth into an irrigation time and, for a hose reel, into a travel speed. The concepts it relies on are explained in the article Should you refill the soil’s available water before summer?.
Compare the water your irrigation system delivers each day with your crop's peak demand, then convert a depth into an irrigation time or, for a hose reel, into a travel speed.
Link copiedCopy this link
Paste it into any browser to return to this simulation with your settings.
Your browser did not allow copying: select the link below and copy it.
Also receive the simulation by email
Keep this simulation: you will receive the details of your settings, the result and a link to reopen it at any time.
If it has not arrived within a few minutes, please check your spam folder.
The calculation link is incomplete or contains a value out of range: the default example is shown.
Examples
Your system
The calculation covers one water supply point (pump, hydrant or canal) and the area it irrigates with a single irrigation method. The fields to fill in depend on the irrigation method chosen.
The calculator assumes similar blocks: same irrigation method, same equipment, same area, same irrigation time. If that is not the case, run one calculation per block:
in step 1, choose the irrigation method of that block, then enter the flow rate it receives and its own area or, if its irrigation method allows, its emitters or sprinklers, with “Number of blocks” set to 1;
in step 2, enter the number of hours that block receives water each day;
copy the calculation link to keep it, then move on to the next block.
Example: a pump runs 20 hours a day for two blocks, tomatoes irrigated for 12 hours and melons for 8 hours. Two calculations are then needed, one with 12 hours, the other with 8 hours.
For several independent pumps, run one calculation per pump. If several pumps supply the same network, add their flow rates together.
Preset value for this irrigation method: nothing needs to be entered. FAO uses 90%; Irmak and colleagues give 85 to 95% for a well-designed and well-managed system.
Calculation basis
Both options describe the same system: choose one and fill in only its fields.
With this irrigation method, the calculation is based on the pump flow rate and the irrigated area.
m³/h
The flow actually delivered during irrigation, not the maximum flow quoted for the pump.
ha
The whole area supplied by this water supply point, all blocks included: 9 ha irrigated in three 3 ha blocks counts as 9 ha.
L/h
Emitter layout
One description is enough.
m
m
Two laterals per row: choose “Per plant” or “Number per m²”.
m
m
Blocks are irrigated one after another. Enter 1 if the whole area is irrigated at the same time.
ha
The whole area, all blocks included. It does not change the irrigation capacity: it is used to show, alongside the result, the flow rate each block requires from the pump.
40 m³/h over 9 ha →0.44 mm of water per hour, over the whole area
Average over the whole area: with this method, blocks do not need to be entered. 1 mm of water over 1 ha is 10 m³.
Irrigation time
Excluding breakdowns, equipment moves and abstraction bans: a ban from 11:00 to 18:00 removes 7 hours.
Water rotation or ban days: a two-day weekly ban leaves 5 days a week.
Crop requirement
The crop's peak ETc
The water the crop uses each day at the peak.
Mid-season Kc: Pereira et al., 2021 (field crops); harvested at high grain moisture.
ETc = 10.5 × 1.20 = 12.6 mm of water per day. At the peak of the June 2026 heatwave, ETo reached 10 mm a day in several regions of France.
To find for how many days the soil's reserve can make up the shortfall.Calculate a soil's RAW
Result
Run the simulation to calculate the result with your settings.
Gross application
8.9mm/day
every day, water pumped divided by the area
Irrigation capacity
8.0mm/day
after losses (90% application efficiency), i.e. 80 m³/ha/day
Share of ETc covered
76%
ETc of 10.5 mm/day: deficit of 2.5 mm of water per day
One irrigation dayAfter losses: irrigation capacity
Water the crop draws from the soil's reserve each day
On each peak day, the crop draws 2.5 mm of water from the soil's reserve: a full RAW of 24 mm is used up in about 10 days. The crop then reduces its transpiration.
To cover this ETc, irrigation would have to run 26 h a day, which is more than 24 h, or the pump would have to deliver 53 m³/h for 20 h.
Water pumped: 89 m³/ha/day, i.e. a continuous flow of 1.03 L/s/ha.
Set one irrigation
For the system described in step 1: the irrigation time that gives a depth, or the depth that a time gives.
What you know
mm
Gross depth: the water the system delivers, in mm over the whole area, before losses.
Irrigation time of one block
h
min
The time the valve of one block stays open.
m/h
The speed at which the hose reel winds the rain gun in.
Similar blocks, as in step 1. Enter 1 if the whole area is irrigated at the same time.
m
The distance between two successive positions of the hose reel. It is narrower than the width wetted by the rain gun, because neighbouring strips overlap.
One hose reel: the rain gun receives the whole pump flow, 40 m³/h.
m
The distance the rain gun travels during one run.
Irrigation time
22 h 30min
10 mm at 0.44 mm of water per hour
The whole area
1.1irrigation days
22 h 30 min, at 20 h a day
Net depth
9.0mm
after losses (90% application efficiency)
This irrigation needs 22 h 30 min, more than the 20 h of irrigation available per day (step 2).
10 mm ÷ 0.44 mm/h → 22 h 30 min.
Receive this simulation by email
A summary of this calculation and a link to reopen it, sent to your inbox.
If it has not arrived within a few minutes, please check your spam folder.
Thank you for your feedback.
It helps us improve this calculator.
Indicative calculation. The gross application is the flow rate multiplied by the irrigation time and divided by the area, averaged over the week according to the days of access to water. The irrigation capacity is the gross application multiplied by the application efficiency, whose default value comes from FAO1, from Irmak and colleagues2 and, for centre pivots, from Kranz and colleagues3. Peak ETc is calculated from ETo and the crop’s mid-season Kc, updated in 20214,5,6. The irrigation time is the depth divided by the application rate7; the travel speed of a hose reel follows the formula of the Cemagref practical irrigation guide8.
Work through the calculator’s five steps in order: your system, the irrigation time, your crop’s requirement, the result, then the settings for one irrigation. Each setting updates the result.
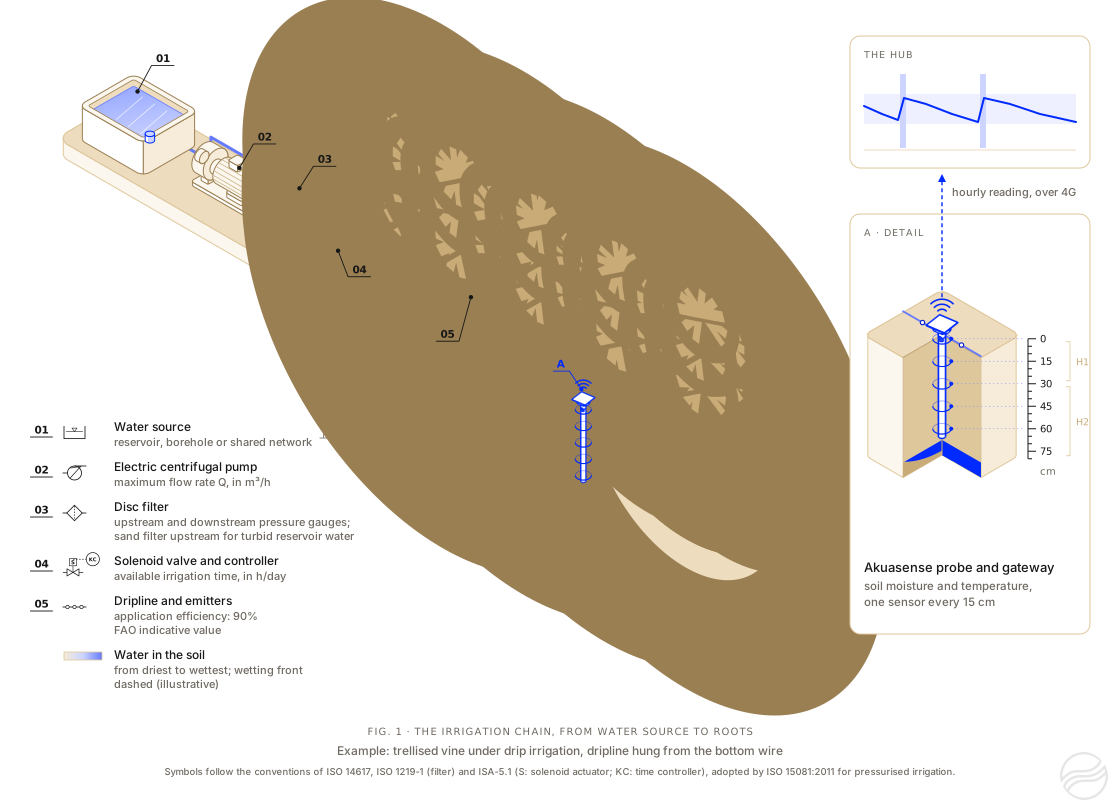
Between the water source and the roots, every component of the system can limit the amount of water applied (Figure 1): the flow rate of the pump, the time for which the controller opens the valve, the number of emitters and their flow rate.
Figure 1. The irrigation chain, from water source to roots: a reservoir, an electric pump, a disc filter, a solenoid valve operated by a controller and a dripline along a row of vines. The flow rate of the pump, the irrigation time allowed by the controller, and the number and flow rate of the emitters determine the water applied each day. The probe measures soil moisture at several depths; the gateway sends its readings over 4G every hour. The symbols in the legend follow the conventions of ISO 1219-1, ISO 14617 and ISA-5.1.
The irrigation method and its efficiency.Application efficiency is the share of the water applied to the field that is stored in the root zone, available to the crop2. The rest is lost as runoff or deep percolation1 and, with sprinklers, through evaporation and wind drift before it even reaches the soil9. Efficiency depends on the irrigation method, but also on irrigation management, soil, slope and crop stage2.
The calculator uses a published reference value for each irrigation method (Table 1), preset so that nothing needs to be entered. The “Change this value” button lets you enter another.
What the calculation covers. The calculation covers one water supply point (a pump, a hydrant or a canal) and the area it irrigates with a single irrigation method, all at once or in blocks irrigated one after another. Describe your system using one of the following two calculation options; only the fields of the chosen option need to be filled in.
The pump flow rate and the irrigated area, for all irrigation methods. The flow rate is the flow actually delivered to the network during irrigation, not the maximum flow quoted for the pump. The area is the whole area the pump supplies, all blocks included. The calculation spreads the pumped water over this area: 40 m³/h over 9 ha is 0.44 mm of water per hour of pumping, on average over the whole area. This is the only option offered for a hose reel, a centre pivot or a linear move, because the instantaneous application rate under the rain gun or along the lateral is far higher than the average over the field; it is also the only one for surface irrigation, with the inflow rate at the head of the field.
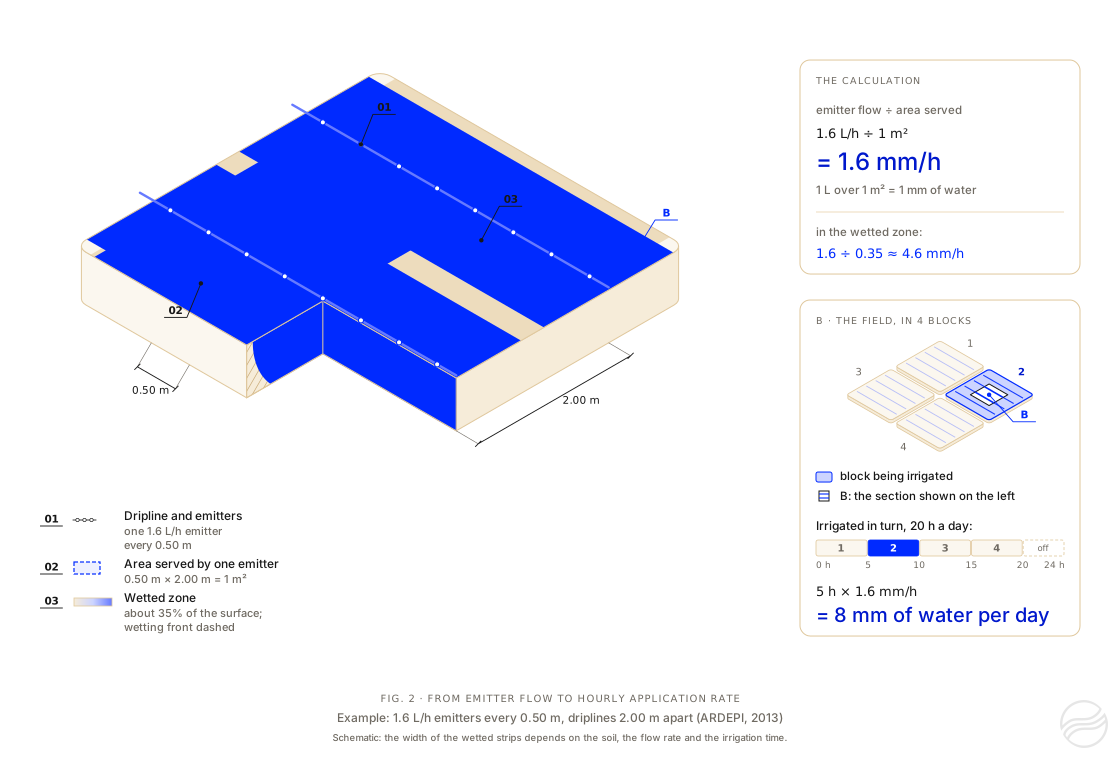
The emitters, micro-sprinklers or sprinklers, for drip, micro-sprinkler and solid-set sprinkler irrigation. The application rate is the flow rate of one emitter divided by the area it waters12, that is, multiplied by the number of emitters per square metre13. Since 1 litre of water over 1 m² is 1 mm of water, 1.6 L/h emitters every 0.50 m on driplines 2 m apart each water 1 m² and apply 1.6 mm of water per hour12 (Figure 2).
Two particular cases of the emitter option:
Emitters counted per plant. Their density is their number per plant divided by the area of each plant, the plant spacing in the row multiplied by the row spacing. For example, six 4 L/h emitters per plant, with plants 6 m apart in the row and rows 6 m apart, apply 0.67 mm of water per hour on the block being irrigated.
Sprinklers. The application rate is the flow rate of one sprinkler, in m³/h, divided by the area it covers, the product of the sprinkler spacing along the lateral and the lateral spacing; 1 m³ of water spread over 1,000 m² is 1 mm. The FAO irrigation manual tabulates it for each nozzle, pressure and spacing7.
Blocks. With the emitter option, when the pump cannot supply the whole field at once, the field is divided into blocks irrigated one after another, as in the design example of the microirrigation chapter of the National Engineering Handbook of the US Department of Agriculture’s Natural Resources Conservation Service (NRCS)13. The irrigation time available is shared between them, and their number must be entered. The irrigated area, which is optional, does not change the irrigation capacity: it lets the calculator also show the flow rate each block requires, which the pump and the water source must be able to supply.
More complex systems. The calculator assumes similar blocks: same irrigation method, same equipment, same area and same irrigation time. When your blocks differ, or several irrigation methods share the same pump, do one calculation per block: in step 1, describe that block on its own, either by the flow rate it receives and its own area, or by its emitters or sprinklers with “Number of blocks” set to 1; in step 2, enter the number of hours it receives water each day. A pump that runs 20 hours a day for tomatoes irrigated for 12 hours and melons irrigated for 8 hours therefore needs two calculations, one with 12 hours, the other with 8 hours. Independent pumps each need their own calculation; when several pumps supply the same network, their flow rates are added together.
Figure 2. From emitter flow to application rate. Each emitter waters a cell whose area is the emitter spacing multiplied by the dripline spacing: a 1.6 L/h emitter on a 1 m² cell applies 1.6 mm of water per hour. The water wets a strip along the dripline, where the depth of water is greater than over the field as a whole. When the field is divided into blocks irrigated in turn, the irrigation time is shared between them: here each block receives 8 mm of water per day, before losses. Schematic only: the actual width of the wetted strips depends on the soil, the flow rate and the irrigation time.
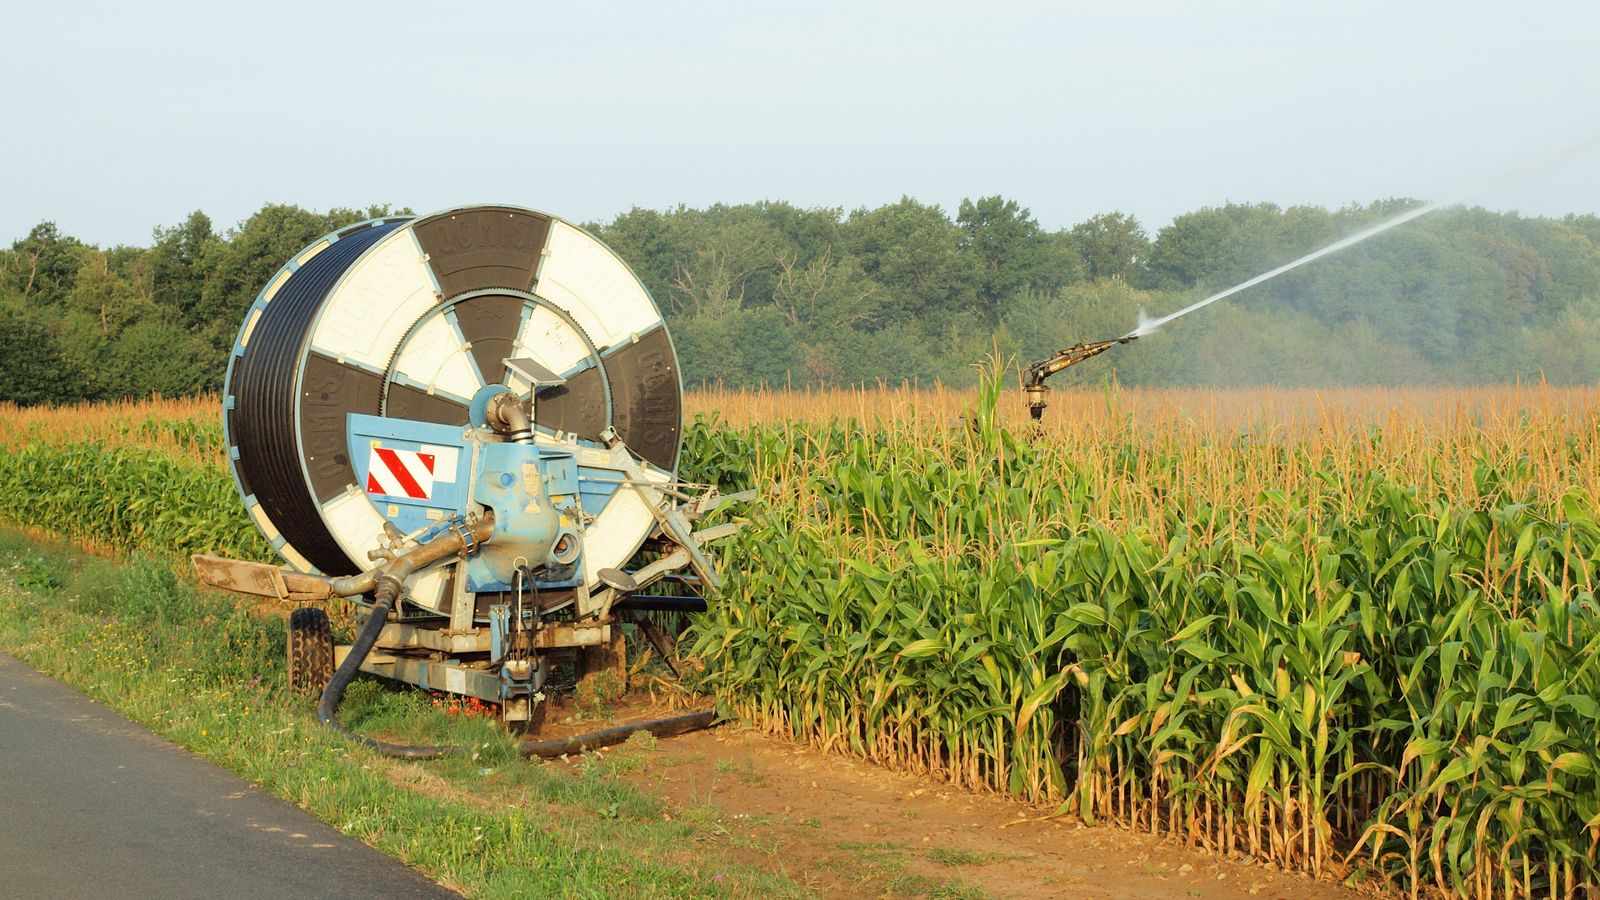
This photograph, taken in August 2015 in the Loiret, France, shows a hose reel irrigating a maize field: the drum in the foreground winds in the hose, which pulls the rain gun across the field. For equipment moved from field to field in this way, irrigation capacity is calculated from the pump flow rate and the whole area it irrigates in one rotation.
The irrigation time available per day is the number of hours the system can run, once time lost to breakdowns, equipment moves and abstraction bans has been deducted.
For sprinkler systems, the NRCS Irrigation Guide notes that it is common to use 22 hours of operation per day, or 6 days per week9.
For localised irrigation, the FAO irrigation manual advises against running more than 90% of the available time or more than 22 hours a day14.
A restriction translates into hours: in the Aude département of southern France in 2025, the “alert” stage of the drought restrictions, set by order of the prefect, the central government’s representative in each département, cut agricultural abstraction for irrigation by 30% where no local irrigation rota (règlement d’arrosage) was in place, by banning abstraction from 11:00 to 18:0015, that is, up to 7 hours less per day.
The days of access to water per week. In a shared network, when the network’s operation requires it, the operator may set up a water rotation to serve irrigators fairly16; during a drought, a prefectoral order may also ban irrigation on certain days. In 2023, the alert stage in the Gironde imposed either a ban on agricultural abstraction two days a week or a 30% reduction in volume or time17.
The calculator spreads the water applied on irrigation days over the seven days of the week: a system that applies 8.9 mm of water on the days it runs, 5 days a week, applies 6.3 mm per day on average.
Peak ETc is the crop’s evapotranspiration on the most demanding days of the season, with the crop at full cover, in its mid-season stage. It is obtained by multiplying ETo, the atmospheric demand for water, by the mid-season crop coefficient Kc10. French irrigation bulletins often call it ETM, maximum evapotranspiration.
The calculator offers the Kc values updated in 2021 for field crops and vegetable crops4,5, and for fruit trees and vines6, the latter by planting density and ground cover class (Table 2).
At the peak of the heatwave, from 21 to 25 June 2026, ETo reached 10 mm of water per day in the Auvergne, Centre-Val de Loire, Île-de-France and Limousin regions of France, according to Arvalis, the French applied research institute for arable crops18. The examples on this page use an ETc or an ETo of 10.5 mm of water per day, an illustrative value taken from the article on available water. Estimated daily crop ET is not the average daily use over a longer period9: peak ETc is compared with irrigation capacity over the length of a heatwave.
The field’s RAW, which is optional, is the readily available water: the part of the soil’s total available water that the crop extracts without reducing its transpiration. The available water capacity calculator estimates it horizon by horizon. With it, the result shows for how many days the soil’s reserve can make up the shortfall between peak ETc and irrigation capacity.
the top bar shows the water applied on one irrigation day;
the next one, the weekly average, when water is not available every day;
the last one, the irrigation capacity, after losses;
the dashed line marks peak ETc, and the hatched part the water the crop draws from the soil’s reserve each day.
The result also gives the irrigation time or the flow rate that would be needed to cover peak ETc.
The “Copy the link to this calculation” button copies a URL that holds every setting: opened in a browser, it shows the same calculation.
Format of the calculation linkShowHide
The page URL accepts the following parameters, which are the same in every language:
sys: identifier of the irrigation method (Table 1);
eff: optional, application efficiency in %, a whole number from 40 to 100; if present, the calculator opens the manual setting;
m: the calculation basis, pump (the pump flow rate, for every irrigation method) or emitters (the emitters, micro-sprinklers or sprinklers, for drip, micro-sprinkler and solid-set sprinkler irrigation only);
with m=pump: q, pump flow rate in m³/h, from 0.5 to 2000, and s, irrigated area in ha, from 0.1 to 1000; except for centre pivots and hose reels, n, optional, number of blocks irrigated one after another, a whole number from 1 to 20, for the irrigation time of one block in step 5 (1 by default);
with m=emitters: qe, flow rate of one emitter, micro-sprinkler or sprinkler: in L/h, from 0.1 to 500, for an emitter or a micro-sprinkler; in m³/h, from 0.05 to 50, for a sprinkler; grid, layout, in one of the following forms (for sprinklers, the first only):
spacing along the lateral x lateral spacing, in m, from 0.05 to 30 and from 0.1 to 30, for example 0.5x2;
plant:emitters per plant:plant spacing in the row x row spacing, a whole number from 1 to 40, then in m from 0.05 to 20 and from 0.1 to 20, for example plant:6:6x6;
a number of emitters per m², from 0.01 to 50, for example 1.25;
with m=emitters, also: n, number of blocks irrigated one after another, a whole number from 1 to 20, and s, optional, irrigated area in ha, from 0.1 to 1000, for the flow rate of each block;
h: irrigation time available per day, in hours, a multiple of 0.5 from 1 to 24;
d: days of access to water per week, a whole number from 1 to 7;
the crop’s requirement, in one of two ways: etc, peak ETc in mm/day, from 1 to 15; or crop, crop identifier (Table 2), with et0 (with a zero), ETo in mm/day, from 1 to 14; etc and et0 have one decimal place at most;
raw: optional, the field’s RAW in mm, a whole number from 5 to 200;
the settings for one irrigation (step 5), optional, in one of the following ways: dose, gross irrigation depth in mm, from 0.5 to 100, with one decimal place at most; dur, irrigation time of one block, or of one revolution for a centre pivot, in minutes, a whole number from 1 to 59,999 (not for hose reels); or v, travel speed in m/h, from 8 to 160, with one decimal place at most (hose reels only); with none of the three, the starting depth for the irrigation method (10 mm for drip and micro-sprinkler irrigation, 30 mm for solid-set sprinklers and hose reels, 20 mm for centre pivots, 50 mm for surface irrigation);
for hose reels only: w, lane spacing in m, a whole number from 30 to 130 (72 by default); reels, hose reels irrigating at the same time, a whole number from 1 to 10 (1 by default); len, optional, length of one run in m, a whole number from 50 to 1000.
Decimals are written with a point. An incomplete link, or one with a value outside these limits, shows the default example with a message.
Example: https://docs.akuasense.com/en/blog/irrigation-system-capacity-calculator/?sys=drip&m=pump&q=40&s=9&n=3&h=20&d=7&etc=10.5&raw=24&dose=10 describes the system in the example, a 40 m³/h pump for 9 ha under drip irrigation, 20 hours a day, 7 days a week, against a peak ETc of 10.5 mm of water per day and a RAW of 24 mm; the calculator shows a gross application of 8.9 mm of water per day, an irrigation capacity of 8.0 mm, a RAW used up in about 10 days and, for a depth of 10 mm, 7 h 30 min of irrigation per block.
5. Set one irrigation: depth, time and hose reel travel speed
The last step converts an irrigation depth, in mm of water, into an irrigation time, or a time into a depth, for the system described in step 1. Choose what you know: the depth or the time (for a hose reel, the depth or the speed).
The depth you enter is a gross depth: the water the system delivers, before losses. The result also gives the net depth, the part that remains available to the crop: the gross depth multiplied by the application efficiency7.
With emitters or sprinklers, the irrigation time of one block is the depth divided by the application rate of the block7,8: 10 mm at 0.67 mm of water per hour takes 15 hours. The result then gives the time needed to irrigate all the blocks, one after another, and flags it if it exceeds the irrigation time available per day.
With the pump flow rate, the step asks for the number of blocks irrigated one after another, assumed to be similar. The whole area receives the depth in a pumping time equal to ten times the depth multiplied by the area, divided by the flow rate7: 10 mm over 9 ha with 40 m³/h takes 22 hours 30 minutes of pumping, or 7 hours 30 minutes per block with three blocks. For a centre pivot, this time is that of one revolution.
With a hose reel, the depth applied to the strip depends on three settings: the flow rate of the rain gun, the lane spacing and the travel speed8,19.
The lane spacing is the distance between two successive positions of the hose reel. It is narrower than the width wetted by the rain gun, because neighbouring strips overlap: the Cemagref practical guide sets it at 1.6 times the throw of the jet in an area with little wind (69 m for a 43 m throw), and narrower in an area that is usually windy8.
The flow rate of each rain gun is that of the pump, divided by the number of hose reels irrigating at the same time.
The travel speed follows from the target depth: 1,000 times the flow rate of the rain gun, divided by the lane spacing multiplied by the depth8. With 50 m³/h, a 72 m lane spacing and 30 mm, the hose reel must travel at 23 m/h.
The length of one run, which is optional, gives the duration of each run and the number of runs needed to irrigate the whole area. The calculator flags a speed outside the usual range of hose reels, 8 to 160 m/h20.
02
Interpreting the result: irrigation capacity and peak ETc
The gross application is the water pumped or delivered, divided by the irrigated area. The gross application on an irrigation day is the flow rate multiplied by the irrigation time, divided by the area; the mean gross application is that figure multiplied by the share of days in the week with access to water.
The irrigation capacity is the mean gross application multiplied by the application efficiency: the water that remains available to the crop. The NRCS Irrigation Guide likewise distinguishes gross system capacity, the water pumped, from net system capacity, the water that reaches the root zone: the former is the latter divided by the application efficiency9.
G=10×AQ×t×7d
C=G×E
G: mean gross application, in mm of water per day; C: irrigation capacity, in mm of water per day
Q: pump flow rate, in m³/h; t: irrigation time available, in h/day; A: irrigated area, in ha; d: days of access to water per week; E: application efficiency
the factor 10 comes from 1 mm of water over 1 ha being 10 m³
G=q×D×Nt×7d
from the emitters or sprinklers: q: flow rate of one emitter or sprinkler, in L/h (for a sprinkler, the flow rate in m³/h multiplied by 1,000); D: number of emitters or sprinklers per m²; q×D: application rate, in mm of water per hour; N: number of blocks irrigated one after another
example: 40×20÷(10×9)=8.9 mm of water pumped per day (40 m³/h, 20 h/day, 9 ha, 7 days a week); with an application efficiency of 90%, 8.0 mm of water per day remain available to the crop; 5 days a week, 5.7 mm
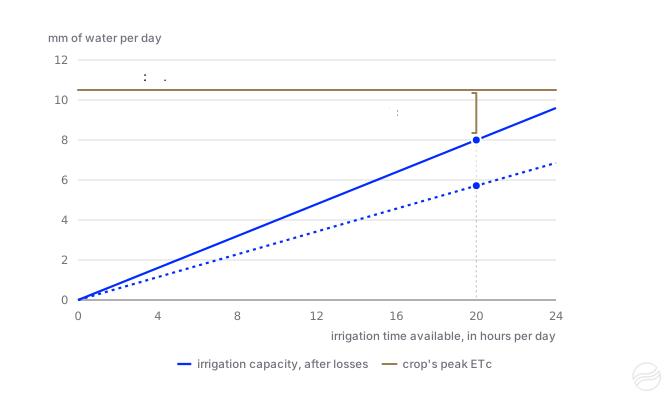
The pump flow rate sets a ceiling, which the irrigation time and the days of access to water lower: with the pump in the example, 24 hours of irrigation a day, 7 days a week, gives at most 9.6 mm of water per day, less than the peak ETc of 10.5 mm (Figure 3).
The same figures can be expressed as a volume: 1 mm of water per day is 10 m³ per hectare per day. They can also be expressed as a continuous flow, the unit used by shared networks and abstraction licences: 1 L/s/ha, delivered 24 hours a day, is 8.64 mm of water per day.
Figure 3. Irrigation capacity of the system in the example (40 m³/h pump for 9 ha under drip irrigation, 90% application efficiency) by the irrigation time available each day, with 7 and 5 days of access to water per week. Even irrigating 24 hours a day, 7 days a week, it does not exceed 9.6 mm of water per day and stays below a peak ETc of 10.5 mm.
When the irrigation capacity is lower than ETc, the crop draws the difference from the soil’s reserve each day. A full RAW then delays water stress by a number of days equal, as a first approximation, to the RAW divided by this shortfall: with an irrigation capacity of 8.0 mm of water per day against an ETc of 10.5 mm, a RAW of 24 mm is used up in about 10 days.
The NRCS Irrigation Guide describes this trade-off. The most conservative design gives the system enough capacity to meet peak ETc, counting neither rainfall nor the soil’s reserve; counting both, a system of lower capacity can be designed9. The same guide states that a system should never be designed on the assumption of adequate rainfall during the irrigation season, and, of centre pivots, that a system not designed to fully meet peak daily use generally cannot keep up during long periods of very hot, dry weather9.
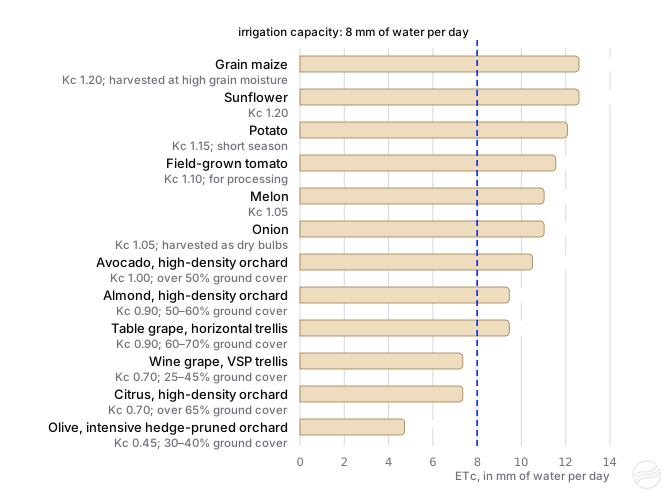
Peak ETc depends on the crop. With an ETo of 10.5 mm of water per day, the irrigation capacity in the example, 8.0 mm of water per day, does not cover the mid-season ETc of any of the field and vegetable crops in Figure 4 (maize, sunflower, potato, tomato, melon, onion), nor that of an avocado orchard, an almond orchard or a table grape vineyard; it covers that of a wine grape vineyard, an olive grove or a citrus orchard.
Figure 4. Mid-season ETc of a few crops for an ETo of 10.5 mm of water per day, calculated with the standard Kc values updated in 2021, without climatic adjustment, and compared with the irrigation capacity in the example, 8.0 mm of water per day. For fruit trees and vines, Kc depends on planting density and on ground cover, that is, the fraction of the ground covered by foliage: the class used is shown under each of these crops. Actual values also depend on the variety, crop management and local climate4,5,6.
Covering the whole of ETc is not always the aim. In 2011, during the public debate on the Aqua Domitia project in southern France, the French Wine and Vine Institute (IFV) and the chambers of agriculture of the Gard and Vaucluse recommended low daily applications for drip-irrigated vines, of 1 to 2 mm of water per day21: irrigation capacity is then compared with the target application rather than with ETc.
Finding the flow rate or time that would be needed. The formula can be read the other way round. To design a network, P. Guillaume calculates the required flow rate from the gross peak requirement, that is, the net peak requirement divided by the estimated efficiency of the system, multiplied by 10 and by the area, then divided by the irrigation time available22. To cover 10.5 mm of water per day over the 9 ha in the example, irrigation would have to run for just over 26 hours a day, which is more than 24 hours, or a flow of about 53 m³/h would be needed for 20 hours.
Measuring the effect of a restriction. For a system that ran 7 days a week, a ban on two days a week removes 29% of the irrigation capacity; a ban on abstraction from 11:00 to 18:00 removes up to 7 hours from the time available.
Finding the maximum depth per pass. With equipment moved from field to field, such as a hose reel, the irrigation capacity multiplied by the length of the rotation gives the depth each field can receive per pass, after losses. For the hose reel in the example (a 50 m³/h pump for 20 ha, 20 hours a day, Table 3), the irrigation capacity is 3.5 mm of water per day, that is, 24.5 mm over a 7-day rotation. Arvalis observes rotations that often last 7 to 8 days23.
Checking the pump against the network. In the NRCS design example, the field is divided into three equal blocks, irrigated one after another, to stay within the flow rate of the pump13; if a block requires more than the pump supplies, the pressure in the network drops, and with it the flow rate of the emitters. In the citrus example (six 4 L/h emitters per plant, plants 6 m by 6 m, 2 blocks over 12 ha, Table 3), each 6 ha block requires 40 m³/h.
The conversions of step 5 rest on the same quantities. The irrigation time is the depth divided by the application rate7; with the pump flow rate, it is written directly from the flow rate and the area. The depth applied by a hose reel is set by the flow rate of the rain gun, the lane spacing and the travel speed8,19.
t=rI
T=Q10×I×A
v=W×I1,000×Qg
t: irrigation time of one block, in h; I: gross irrigation depth, in mm; r: application rate of the block, in mm of water per hour
T: pumping time for the whole area to receive the depth, in h; A: irrigated area, in ha; Q: pump flow rate, in m³/h
v: travel speed of the hose reel, in m/h; Qg: flow rate of one rain gun, in m³/h; W: lane spacing, in m
net depth: I×E, E being the application efficiency; example: 1,000×50÷(72×30)=23 m/h
The Cemagref practical guide gives an example: a 38 m³/h rain gun, at a 69 m lane spacing, must travel at 22 m/h to apply 25 mm, and at 14 m/h for 40 mm8. The same guide puts the application rate under a rain gun at 8 to 12 mm/h8: this is the rate at which water falls where the gun is watering, not the depth, which depends on the travel speed.
Published reference figures only hold under the conditions in which they were obtained. At the peak of the June 2026 heatwave, Arvalis noted that daily ETo values “often exceeded the capacity of irrigation equipment (even under centre pivots)” (our translation)18. In 2008, Arvalis gave the example, on the medium boulbènes of the Garonne terraces, crusting silty soils of south-western France, of a system whose capacity remained below peak requirements: it applied 4.3 mm of water per day, against a mean requirement of 5.5 mm per day in July, calculated by ten-day period23. In the Adour basin, in 2009, authorised abstraction volumes were converted into irrigable areas on the basis of a theoretical unit requirement of 0.7 L/s/ha on free-draining soils (sands, alluvium) and 0.6 L/s/ha on heavy soils (molasse)24, that is, 6.0 and 5.2 mm of water per day of continuous flow.
In the United States, centre pivots are often designed to barely meet peak ETc, or even to fall short of it9. In north-west Kansas, on a deep silt loam, 34-year simulations give for maize, with an 85% efficient centre pivot, a minimum gross capacity of 6.7 mm of water per day in July and August, sufficient one year in two; maize ETc there has short-lived peaks of 9 to 10 mm of water per day, and calculated values sometimes approach 13 mm in the central Great Plains25.
The Adour and Kansas references concern pumped water: they compare with the gross application, not with the irrigation capacity. Arvalis does not state whether its 4.3 mm is gross or net.
The result is an order of magnitude, for six reasons.
Efficiency is a benchmark. Irmak and colleagues give “potential” values, for well-designed and well-managed systems, and point out that they vary widely with management2. Published values also depend on the definition used. Relative to the water leaving the equipment, the water reaching the soil is at least 90% under drip irrigation, under controlled conditions26. In France, the measurements of the CASDAR-Eau project in the Midi-Pyrénées region (2007 to 2010), which count only losses in the air, put solid-set sprinklers between 70–75% and 95% depending on wind and pressure, and hose reels rarely below 85–90%27. These measurements do not count the water that then runs off or drains below the roots, which the calculator’s application efficiency does count.
The actual flow rate may differ from the nominal one. The flow rate of a pump or an emitter depends on the pressure in the network: only a meter gives the volume actually applied.
Under drip irrigation, water is concentrated under the emitters. Only a fraction of the surface is wetted, 30 to 40% according to FAO10,28; the depth of water in this zone is the depth over the field divided by this fraction10. An application of 8 mm of water over the field is therefore about 23 mm in the wetted zone, with a fraction of 0.35. The depths in step 5 are over the irrigated area, not over the wetted zone.
With sprinklers, the application rate must not exceed the soil’s infiltration rate, otherwise water runs off7; the calculator does not check this.
With a hose reel, the depth is even only over the length travelled at constant speed. The start and end delays, when the rain gun waters on the spot, count neither in the depth nor in the duration of a run.
Rainfall is not counted, and the soil’s reserve is not part of the irrigation capacity: it is used only to estimate how many days the shortfall takes to use it up.
The calculator uses only the values below and the formulas on this page: the same calculation can be done by hand.
Table 1. Irrigation methods: calculation basis and application efficiencyShowHide
Irrigation method
Identifier
Calculation basis
Efficiency used (%)
Published values (%)
Drip irrigation
drip
pump flow rate or emitters
90
FAO: 90; Irmak et al.: 85–95 surface, over 95 subsurface
Micro-sprinkler irrigation
micro-sprinkler
pump flow rate or micro-sprinklers
85
Irmak et al.: 85–90
Sprinkler irrigation: solid set
sprinkler
pump flow rate or sprinklers
75
FAO: 75 (sprinkler); Irmak et al.: 70–85 (solid set)
Hose reel (rain gun)
hose-reel
pump flow rate
70
Irmak et al.: 65–75
Centre pivot or linear move
pivot
pump flow rate
85
Irmak et al.: 75–85, 80–90 with LEPA (low-energy precision application: water placed at ground level through drop tubes); Kranz et al.: 85 by default; 85 (high-pressure impact sprinklers) to 95 (spray heads on drop tubes) depending on the equipment
Surface irrigation: furrow, border, basin
surface
inflow rate at the head of the field
60
FAO: 60; Irmak et al.: 45–65 (furrow), 60–80 (furrow with tailwater reuse), 60–75 (basin), 65–80 (precision-levelled basin)
Application efficiency is the share of the water applied to the field that is stored in the root zone. FAO indicative values (Annex I, Table 8)1; “potential” values from Irmak and colleagues, for well-designed and well-managed systems (Table 2)2; value used by Kranz and colleagues for a centre pivot3. The calculator uses the FAO value where there is one; for the methods FAO does not distinguish, a value within the range given by Irmak and colleagues, and for the centre pivot, the value used by Kranz and colleagues.
Table 2. Mid-season Kc of the crops offeredShowHide
Crop
Identifier
Type or ground cover class
Mid-season Kc
ETc for an ETo of 10.5 mm of water per day
Source
Crop with full ground cover
full-cover
—
1.00
10.5
Illustrative value
Grain maize
grain-maize
harvested at high grain moisture
1.20
12.6
Pereira et al., 2021 (field crops)
Durum wheat
durum-wheat
autumn-sown, harvested as dry grain
1.05
11.0
Pereira et al., 2021 (field crops)
Grain sorghum
grain-sorghum
—
1.10
11.6
Pereira et al., 2021 (field crops)
Sunflower
sunflower
—
1.20
12.6
Pereira et al., 2021 (field crops)
Soybean
soybean
—
1.15
12.1
Pereira et al., 2021 (field crops)
Cotton
cotton
—
1.10
11.6
Pereira et al., 2021 (field crops)
Potato
potato
short season
1.15
12.1
Pereira et al., 2021 (vegetables)
Field-grown tomato
processing-tomato
for processing
1.10
11.6
Pereira et al., 2021 (vegetables)
Melon
melon
—
1.05
11.0
Pereira et al., 2021 (vegetables)
Onion
onion
harvested as dry bulbs
1.05
11.0
Pereira et al., 2021 (vegetables)
Sweet pepper
bell-pepper
—
1.10
11.6
Pereira et al., 2021 (vegetables)
Avocado, high-density orchard
avocado
over 50% ground cover
1.00
10.5
Rallo et al., 2021
Almond, high-density orchard
almond
50–60% ground cover
0.90
9.5
Rallo et al., 2021
Table grape, horizontal trellis
table-grape
60–70% ground cover
0.90
9.5
Rallo et al., 2021
Wine grape, VSP trellis
wine-grape
25–45% ground cover
0.70
7.4
Rallo et al., 2021
Citrus, high-density orchard
citrus
over 65% ground cover
0.70
7.4
Rallo et al., 2021
Olive, intensive hedge-pruned orchard
olive
30–40% ground cover
0.45
4.7
Rallo et al., 2021
Standard Kc values updated in 2021 for field crops4, vegetable crops5, fruit trees and vines6, without climatic adjustment. For fruit trees and vines, Kc depends on planting density and ground cover, that is, the fraction of the ground covered by foliage. The crop with full ground cover, with a Kc of 1.00, is an illustrative value.
Table 3. Calculator examples and resultsShowHide
Example
System
Irrigation time
Requirement
Gross application (mm of water per day)
Irrigation capacity (mm of water per day)
ETc (mm of water per day)
Share of ETc covered (%)
Drip, 9 ha
Drip (90%), 40 m³/h pump for 9 ha
20 h a day, 7 days a week
ETc of 10.5 mm/day; RAW of 24 mm
8.9
8.0
10.5
76
Drip, 9 ha, 5 days a week
Drip (90%), 40 m³/h pump for 9 ha
20 h a day, 5 days a week
ETc of 10.5 mm/day; RAW of 24 mm
6.3
5.7
10.5
54
Hose reel, 20 ha
Hose reel (70%), 50 m³/h pump for 20 ha
20 h a day, 7 days a week
Grain maize (Kc 1.20), ETo of 10.5 mm/day
5.0
3.5
12.6
27
Citrus, emitters per plant
Drip (90%), six 4 L/h emitters per plant, plants at 6 m × 6 m, 2 blocks, 12 ha
Times rounded to the minute. For hose reels, the speed shown is rounded to the m/h (to a tenth below 10 m/h), and the duration of a run and of the rotation are calculated with that speed, the one actually set.
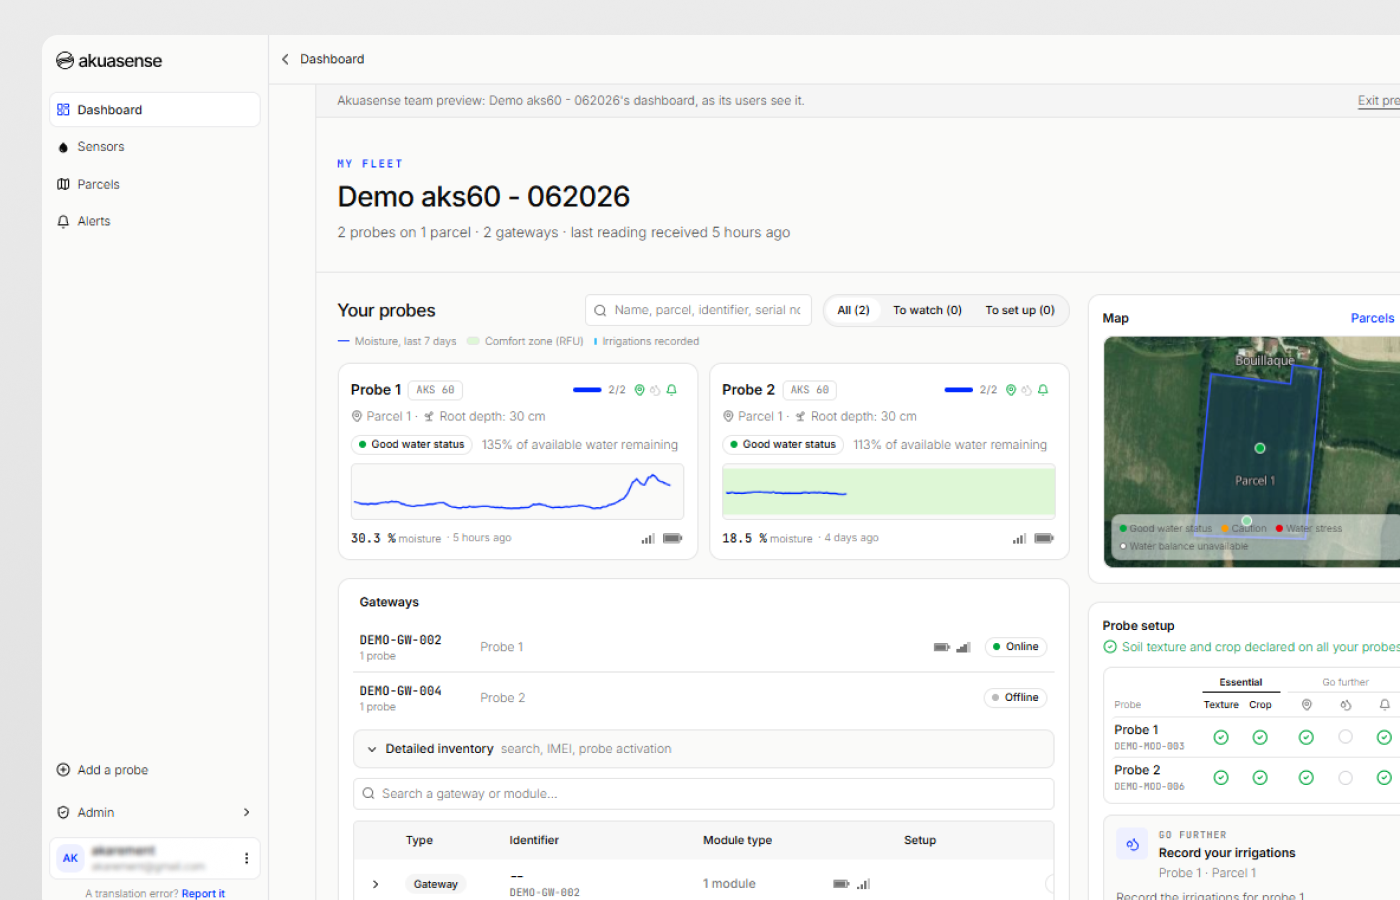
The hub, the web app for Akuasense connected soil moisture probes, records the irrigation system of each probe. In its settings, you declare:
the irrigation method;
for drip or micro-sprinkler irrigation, the flow rate of one emitter and the emitter density, from their spacings, their number per plant or their number per square metre, as with the emitters in this calculator; for sprinklers or a centre pivot, a flow rate per unit area, in mm per hour;
the area irrigated in one rotation.
The hub derives the application rate of the system from these. It then converts each recorded irrigation, from its duration or from the volume read on the meter, into mm of water over the field and mm in the wetted zone, using the wetted fraction FAO gives for the irrigation method28: this is the conversion of step 5 of this calculator. An irrigation schedule describes the irrigation calendar: days, start times and amount.
This calculator adds what the hub does not calculate: the irrigation capacity over the week, taking into account the hours and days of access to water and the efficiency of each irrigation method, its comparison with peak ETc, the flow rate or time that would be needed to cover it, and the settings of a hose reel.
Measurement shows what calculation can only estimate: whether soil moisture falls despite irrigation at the system’s maximum capacity, how deep the water from each irrigation goes, and whether some of it passes below the roots. Akuasense probes measure soil moisture and temperature every 15 cm, once an hour, and the hub places the recorded irrigations alongside the moisture curves. These measurements add to the farmer’s own knowledge of the field, the crop and the water supply.
Brouwer C., Prins K., Heibloem M. (1989). Irrigation Water Management: Irrigation Scheduling. Training Manual no. 4. FAO, Rome. Annex I, Table 8. fao.org
Irmak S., Odhiambo L.O., Kranz W.L., Eisenhauer D.E. (2011). Irrigation Efficiency and Uniformity, and Crop Water Use Efficiency. University of Nebraska–Lincoln Extension, EC732. Table 2. extensionpubs.unl.edu
Kranz W.L., Martin D.L., Irmak S., van Donk S.J., Yonts C.D. (2008). Minimum Center Pivot Design Capacities in Nebraska. University of Nebraska–Lincoln Extension, NebGuide G1851. extensionpubs.unl.edu
Pereira L.S., Paredes P., Hunsaker D.J., López-Urrea R., Mohammadi Shad Z. (2021). Standard single and basal crop coefficients for field crops. Updates and advances to the FAO56 crop water requirements method. Agricultural Water Management, 243, 106466. doi:10.1016/j.agwat.2020.106466
Pereira L.S., Paredes P., López-Urrea R., Hunsaker D.J., Mota M., Mohammadi Shad Z. (2021). Standard single and basal crop coefficients for vegetable crops, an update of FAO56 crop water requirements approach. Agricultural Water Management, 243, 106196. doi:10.1016/j.agwat.2020.106196
Rallo G., Paço T.A., Paredes P., Puig-Sirera À., Massai R., Provenzano G., Pereira L.S. (2021). Updated single and dual crop coefficients for tree and vine fruit crops. Agricultural Water Management, 250, 106645. doi:10.1016/j.agwat.2020.106645
Savva A.P., Frenken K. (2001). Sprinkler Irrigation Systems: Planning, Design, Operation and Maintenance. Irrigation Manual, Module 8. FAO Sub-Regional Office for East and Southern Africa, Harare. Pp. 7–13. openknowledge.fao.org
Rieul L. (coord.) (1992). Irrigation – Guide pratique [Irrigation: a practical guide], 2nd edition. Cemagref-Dicova and Éditions France Agricole, Antony and Paris. Pp. 94, 143, 144 and 158. hal.inrae.fr
USDA NRCS (1997). National Engineering Handbook, Part 652: Irrigation Guide. Washington. Chapter 4, pp. 4-3 and 4-4; Chapter 6, p. 6-45. irrigationtoolbox.com (Chapter 4), irrigationtoolbox.com (Chapter 6)
Allen R.G., Pereira L.S., Raes D., Smith M. (1998). Crop evapotranspiration. Guidelines for computing crop water requirements. FAO Irrigation and Drainage Paper 56, Rome. Chapters 5 to 7 (Equations 56 and 61; Table 20). fao.org
Gaudin R. (1999). L'évaluation des besoins en eau de la canne [Assessing the water requirements of sugar cane]. Agriculture et Développement, 24, 10-20. Cirad. agritrop.cirad.fr
ARDEPI (2013). L'irrigation goutte à goutte en arboriculture et culture maraîchère [Drip irrigation in orchards and market gardening]. Technical content: I. Boyer. ARDEPI, Aix-en-Provence. pseau.org
USDA NRCS (2013). National Engineering Handbook, Part 623 Irrigation, Chapter 7: Microirrigation. Washington. Equations 7-42b and 7-46; p. 7-179. directives.nrcs.usda.gov
Savva A.P., Frenken K. (2002). Localized Irrigation Systems: Planning, Design, Operation and Maintenance. Irrigation Manual, Module 9. FAO Sub-Regional Office for East and Southern Africa, Harare. P. 9. openknowledge.fao.org
Préfecture de l'Aude (2025). Arrêté DDTM-SAFEB-2025-010, annexe 7 : mesures de restriction des usages de l'eau [Prefectoral order DDTM-SAFEB-2025-010, Annex 7: water use restriction measures]. Copy published by the town of Limoux, archived on 18 July 2025. web.archive.org
Société du Canal de Provence (2022). Conditions générales “Eaux d'irrigation agricole” [General conditions: agricultural irrigation water], in force from 1 March 2022. canaldeprovence.com
Préfecture de la Gironde (2023). Arrêté de restriction des usages de l'eau du 13 juillet 2023, annexes [Prefectoral order of 13 July 2023 restricting water use, annexes]. gironde.gouv.fr
Arvalis (2026). “Maïs grain : comment gérer la conduite de parcelles suite à la canicule” [Grain maize: managing fields after the heatwave]. Terre-net, 3 August 2026. terre-net.fr
Chambre d'agriculture du Gers (2022). Bulletin conseil d'irrigation été n° 4 [Summer irrigation advice bulletin no. 4], 6 July 2022, section “Les réglages de l'enrouleur” [Hose reel settings]. hapy.chambre-agriculture.fr
Cemagref (2010). Fiche E4 “Enrouleur et canon d'irrigation” [Data sheet E4: hose reel and rain gun]. Fiches sécurité des machines agricoles et forestières [Safety data sheets for agricultural and forestry machinery], published by the French Ministry of Agriculture. agriculture.gouv.fr
Payan J.-C., Salançon E., Genevet B., Jacquet O. (2011). “Projet Aqua Domitia : faut-il irriguer la vigne ? Effets de l'irrigation au vignoble” [Aqua Domitia project: should vines be irrigated? Effects of irrigation in the vineyard]. Public debate on the Aqua Domitia project, public meeting of 3 November 2011. IFV, chambers of agriculture of the Gard and the Vaucluse. Slide “Fréquence des irrigations” [Irrigation frequency]. debatpublic.fr
Guillaume P. (1991). Détermination en continu des paramètres de gestion et de commande d'un système d'irrigation au moyen d'un humidimètre à neutrons [Continuous determination of the management and control parameters of an irrigation system using a neutron moisture meter]. Fruits, 46(5), 543-550. revues.cirad.fr
Deumier J.-M., Jacquin C., Berrodier M., Lacroix B., Bouthier A. (2008). “La mise en œuvre de pratiques innovantes en vue de mieux valoriser la ressource en eau chez les agriculteurs” [Implementing innovative practices to make better use of water on farms]. Carrefour de l'innovation agronomique “Production végétale et sécheresse” [Agronomic innovation forum: crop production and drought], Toulouse, 6 June 2008. Arvalis. Slide “Un chantier avec une forte inertie” [A slow-to-respond operation]. ciag.hub.inrae.fr
Observatoire de l'eau du bassin de l'Adour (2009). L'irrigation dans le bassin de l'Adour. Synthèse 2009. [Irrigation in the Adour basin: 2009 summary]. eptb-a3.fr
Lamm F.R., Stone L.R., O'Brien D.M. (2007). Crop production and economics in Northwest Kansas as related to irrigation capacity. Applied Engineering in Agriculture, 23(6), 737-745. doi:10.13031/2013.24057
Bouarfa S., Belaud G., Bouthier A., Brelle F., Coulon C., Gendre S., Grosclaude J.Y., Lacroix B., Molle B., Rollin D., Tournebize J., Serra Wittling C., Vincent B. (2017). Enjeux et défis de l'irrigation et du drainage agricole en France : points de vue de l'AFEID [Issues and challenges of agricultural irrigation and drainage in France: the views of AFEID]. Agronomie, Environnement & Sociétés, 7(2), 49-54. agronomie.asso.fr
Granier J., Deumier J.-M. (2013). Efficience hydraulique et énergétique : les nouveaux critères de performances pour les systèmes d'irrigation du futur [Hydraulic and energy efficiency: the new performance criteria for the irrigation systems of the future]. Sciences Eaux & Territoires, 11, 30-35. doi:10.14758/SET-REVUE.2013.11.07
Pereira L.S., Allen R.G., Paredes P., López-Urrea R., Raes D., Smith M., Kilic A., Salman M. (2025). Crop evapotranspiration. Guidelines for computing crop water requirements. FAO Irrigation and Drainage Paper 56, Rev. 1. FAO, Rome. Table 7.6. doi:10.4060/cd6621en


 Akuasense