The total available water (TAW) of a soil, often called its available water capacity, is the amount of water it can release to a crop over the whole depth of its roots; it is expressed in mm of water. The calculator below lets you estimate it by entering the texture of your soil, horizon by horizon, then derives the readily available water (RAW) of your crop. The concepts it relies on are developed in the article Should you refill the soil’s available water before summer?.
Tool 1: Soil available water capacity (TAW) calculator
Estimate how much water your soil can supply to your crop (TAW and RAW), horizon by horizon.
Link copiedCopy this link
Paste it into any browser to return to this simulation with your settings.
Your browser did not allow copying: select the link below and copy it.
Also receive the simulation by email
Keep this simulation: you will receive the details of your settings, the result and a link to reopen it at any time.
If it has not arrived within a few minutes, please check your spam folder.
The calculation link is incomplete or contains an unknown value: the default example is shown.
Examples
Your crop
Depletion fraction p of 0.50, the value FAO cites as commonly used.
Set the rooting depth you observe in your field.
Your soil, horizon by horizon
Describe each horizon, from the surface downwards: one tab per horizon. The profile is redrawn after each change.
Available water held by each horizon
From 0 to 30 cm
What you know about this horizon
1.95 mm of water per cm of fine earth →59 mm of water
USDA class Silt loam, Saxton and Rawls (2006)
The result
Run the simulation to calculate the result with your settings.
Total available water (TAW)
73mm of water
over 60 cm of root zone, i.e. 730 m³/ha
Readily available water (RAW)
37mm of water
depletion fraction p of 0.50 for this crop
RAW during a heatwave
22mm of water
for an ETc of 10 mm of water per day (p of 0.30)
readily available: 37 mmharder to extract: 37 mm
Without rain or irrigation, a crop with an ETc of 5 mm of water per day uses up this RAW in about 7 days.
Receive this simulation by email
A summary of this calculation and a link to reopen it, sent to your inbox.
If it has not arrived within a few minutes, please check your spam folder.
Thank you for your feedback.
It helps us improve this calculator.
Indicative calculation, horizon by horizon. The water held by each horizon is estimated with the equations of Saxton and Rawls1 for a USDA texture class or a particle-size analysis, and with the values of Bruand, Duval and Cousin2 for a class of the French (Aisne) texture triangle. The water held by stones follows the values used by Arvalis3. RAW is calculated with the depletion fraction p of your crop, taken from FAO-56 or from its 2021 update, or used by the hub, the web app for Akuasense connected soil moisture probes (Table 5)4,5,6.
01
How to use the available water capacity calculator
The calculator is completed in three steps, in order: your crop, your soil, then reading the result. Each change of setting updates the soil profile diagram and the result.
Choosing your crop sets two values: the depletion fraction p and a range of rooting depths. These are the values used by the hub, the web app for Akuasense connected soil moisture probes: depending on the crop, they come from Table 22 of FAO-564 or from its 2021 update by Pereira and colleagues5,6.
The depletion fraction p is the part of TAW your crop can use without suffering from a lack of water. While the soil is well supplied with water, it delivers it fast enough to meet the crop’s demand, and the crop transpires normally. As the soil dries, the remaining water is held more and more tightly and reaches the roots more and more slowly. Below a threshold, it can no longer reach them fast enough to meet the transpiration demand: the crop reduces its transpiration, and water stress begins, well before the wilting point4. The fraction p sets this threshold: with a fraction p of 0.50, the crop can use half of TAW before stress begins. Multiplied by TAW, it gives RAW.
Rooting depth is the depth down to which the crop’s roots take up water. It depends on the species and its age, but also on the soil: a compacted horizon, bedrock or a water table stops the roots. The estimation guide published by Arvalis, the French applied research institute for arable crops, takes as the limit the depth at which a major obstacle to root penetration appears3. It is best observed in a soil pit, or otherwise with an auger7.
FAO specifies that the upper value of the range applies to soils with no significant layering or other characteristics that restrict rooting depth, and that the lower value may be used for irrigation scheduling and the upper value for modelling water stress or for rainfed conditions4. The calculator uses the lower value, as the hub does, and shows the crop’s range.
If roots stop higher in your field, or go deeper, the “Set manually” button opens a slider to enter the observed depth, from 20 to 250 cm. For “Other crop”, the slider is shown straight away.
A horizon is a layer of soil with uniform characteristics. In a soil pit, or in the cores brought up by an auger, one horizon gives way to the next when the colour, texture, structure or stone content changes. The calculator accepts up to five horizons, described from the surface downwards; each tab describes one, with its thickness.
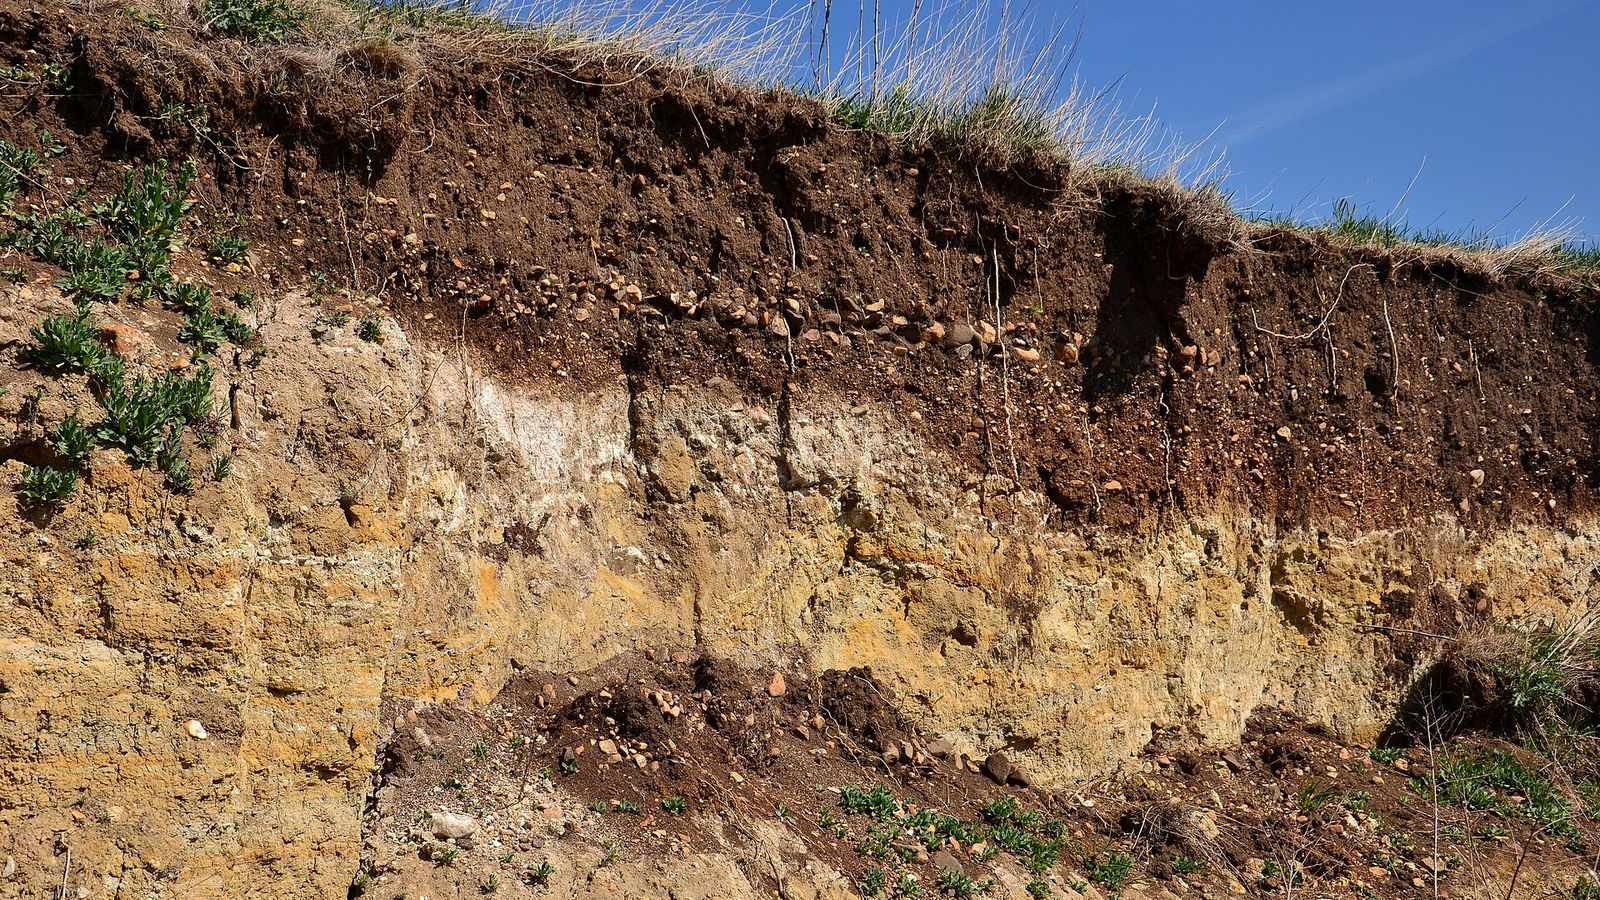
In this photo, taken beside a road near Libědice, in the Czech Republic, the boundary between the dark brown, stony surface horizon and the pale horizon beneath it is visible to the naked eye.
For each horizon, there are three ways to enter the water it holds, from the simplest to the most precise.
Its texture. A class of the USDA texture triangle, the US classification the hub uses, with the values of Saxton and Rawls1; or a class of the French (Aisne) texture triangle, with the values of Bruand, Duval and Cousin2. The latter were measured on undisturbed soil clods, and distinguish the tilled horizon (A) from the deeper horizons (E, B or C). They do not cover calcareous horizons, and some classes have no value: the calculator flags them. The Aisne classes keep their French codes and names, as they have no official English names.
A particle-size analysis. The proportions of sand, silt and clay from the laboratory report, and the organic matter content (2.5% if the report does not give it). The calculator derives the water contents at field capacity and at the wilting point with the equations of Saxton and Rawls1, and places the point on the USDA triangle.
Laboratory measurements. The volumetric water contents measured at field capacity (pF 2) and at the wilting point (pF 4.2), on undisturbed clods3. A laboratory often reports a gravimetric water content, in grams of water per gram of dry soil: it is converted into a volumetric water content by multiplying it by the bulk density of the soil, in g/cm³3. Example: a gravimetric water content of 22% in a soil with a bulk density of 1.4 g/cm³ corresponds to a volumetric water content of 22 × 1.4 = 30.8%.
Stones and gravel. Finally, for each horizon, the calculator asks for the share of stones and gravel, or rock fragments. They occupy part of the horizon’s volume, which therefore contains no fine earth. Their proportion is estimated by eye, with reference charts, or measured on a sample of about twenty kilograms; the two methods can give quite different results3. Arvalis considers that rock fragments can be ignored below 10% of the volume3.
Their type also matters: flint holds almost no water, whereas limestone or chalk does. The calculator applies the values used by Arvalis for each type (Table 4). For a loamy clay horizon containing 30% stones, Tetegan and colleagues calculated that ignoring this water underestimates the available water by 5% with chert and by 33% with chalk8.
The profile shows each horizon to scale. The blue area represents the available water it holds within the root zone, and its value in mm of water is shown in the horizon; the part of a horizon below the roots is not counted. The result gives TAW, RAW and RAW during a heatwave, explained in the next part.
The “Copy the link to this calculation” button copies a URL that contains every setting: opened in a browser, it displays the same calculation. It can be used to save a soil description or to share it with an advisor.
Format of the calculation linkShowHide
The page URL accepts the following parameters, which are the same in every language:
crop: crop identifier (Table 5), or other for a crop not listed;
root: rooting depth, in cm, a multiple of 5 from 20 to 250; if it differs from the crop’s lower value, the calculator opens the manual setting;
h: one horizon, one to five of them, repeated from the surface downwards, in the form thickness,description[,stones:percentage:type], the thickness in cm, a multiple of 5 from 5 to 150, the stone percentage a multiple of 5 from 0 to 80. The description takes one of the following forms:
usda:class, with the identifier of the USDA class (Table 2);
aisne:code:A or aisne:code:EBC, with the code of the Aisne triangle class and the type of horizon (Table 3);
granulo:sand-silt-clay-organic matter, in %, sand + silt + clay adding up to 100;
labo:field capacity-wilting point, in % by volume, the first greater than the second.
The stone type is one of the identifiers in Table 4.
All three parameters are required, and decimals use a point. An incomplete link, or one with a value outside these limits, shows the default example with a message.
Example: https://docs.akuasense.com/en/blog/available-water-capacity-calculator/?crop=grapevine-wine-grape&root=40&h=40,aisne:AL:A,stones:30:limestone describes a 40 cm clay-limestone soil with 30% limestone stones under a wine grape vineyard; the calculator shows a TAW of 50 mm of water and a RAW of 22 mm.
02
Interpreting the result: TAW, RAW and RAW during a heatwave
TAW is the water the soil can release to the crop over the whole root zone: the water held between field capacity and the permanent wilting point4. It is expressed in mm of water; 1 mm of water equals 1 litre per square metre, or 10 m³ per hectare. A TAW of 73 mm thus represents 730 m³ of water per hectare.
RAW is the part of TAW the crop extracts without reducing its transpiration. Once RAW has been used up, the remaining water is held more strongly; the crop partially closes its stomata, and water stress begins. For each crop, FAO publishes the depletion fraction p that gives RAW, valid for an ETc of 5 mm of water per day; it generally ranges from 0.30 to 0.70, and a value of 0.50 is commonly used for many crops4.
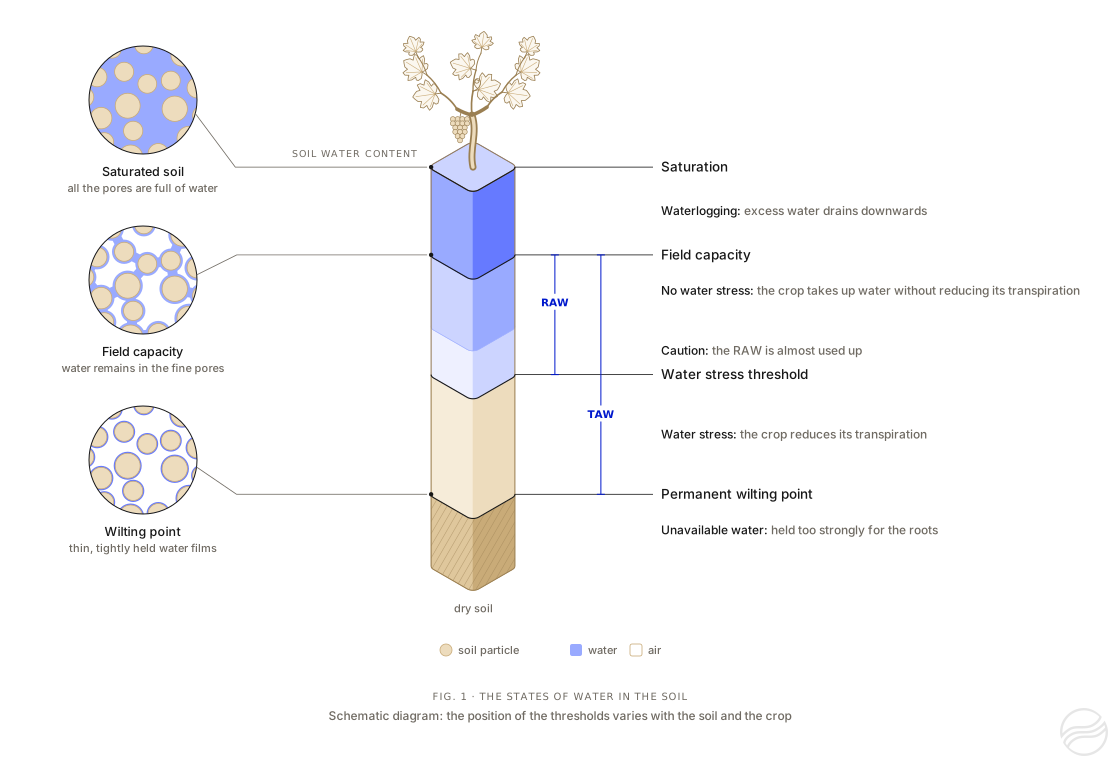
Figure 1. The states of water in the soil. On the left, soil particles under a magnifying glass: at saturation, water fills all the pores; at field capacity, it occupies only the finest pores; at the wilting point, only thin films remain around the particles. In the centre, the soil water content, from dry soil (beige) to saturation (blue), and the four thresholds that separate the states of water for the crop. The vine planted on top of the scale represents the crop; the animation shows how it responds to each state of the water. Schematic diagram: the position of the thresholds varies with the soil and the crop.
RAW during a heatwave takes into account that the fraction p decreases as ETc increases: the roots can no longer extract water fast enough. FAO adjusts it with the formula below, the fraction remaining between 0.1 and 0.84. The calculator applies it for an ETc of 10 mm of water per day: this is the ETo recorded by Arvalis at the peak of the heatwave of late June 20269, and the ETc of a crop whose foliage covers the ground is of the same order.
TAW=horizons∑TAWh
TAWh=[AWCfe×(1−RF)+c×RF]×d
TAWh: available water held by a horizon within the root zone, in mm of water
AWCfe: available water capacity of the fine earth of the horizon, in mm of water per cm, that is (θFC−θWP)×10, with the water contents in m³ of water per m³ of soil
RF: share of the horizon volume occupied by rock fragments (stones and gravel), from 0 to 1 (0.30 for 30%); c: water held by the stones, in mm of water per cm of stones
d: thickness of the horizon within the root zone, in cm
RAW=p×TAW
pheat=p+0.04×(5−ETc)
example: a 30 cm silt loam horizon over a 30 cm sand horizon, without stones, holds 1.95×30+0.49×30=73 mm of water; with p=0.50, RAW is 37 mm; for an ETc of 10 mm of water per day, pheat=0.30 and RAW falls to 22 mm
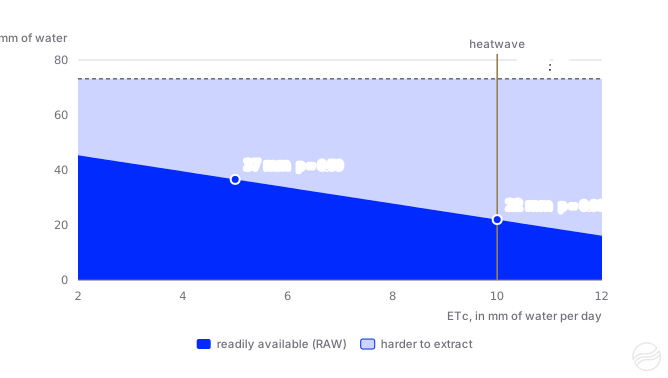
Figure 2. RAW as a function of ETc, for the TAW of the example: 73 mm of water, silt loam over sand, depletion fraction of 0.50. Adjusted with the FAO formula4, the fraction p goes from 0.50 for an ETc of 5 mm of water per day to 0.30 for 10 mm: RAW falls from 37 to 22 mm of water, and it is used up in about 2 days instead of 7.
Estimating how many days RAW lasts. Without rain or irrigation, a full RAW lasts, as a first approximation, a number of days equal to RAW divided by ETc: 37 mm of water for an ETc of 5 mm of water per day lasts about 7 days. This period shortens quickly as ETc rises, since RAW decreases at the same time: for an ETc of 10 mm of water per day, the 22 mm of RAW in the example lasts about 2 days (Figure 2).
Putting an irrigation application in context. FAO specifies that the net depth of an irrigation should be smaller than or equal to the root zone depletion, and that water applied above field capacity drains below the roots4. On a root zone whose RAW has just been used up, a net application larger than RAW, 37 mm in the example, therefore exceeds field capacity. With drip irrigation, only part of the soil surface is wetted, around 30 to 40% according to FAO4: the water is spread over a smaller volume of soil, and this calculation does not apply as it stands.
Comparing. Two horizons, two fields, two rooting depths: the calculator shows which horizon holds the most water, and how much TAW changes when roots reach a few centimetres deeper or shallower.
For a uniform horizon without stones, the available water per cm of soil depends first on texture: around 0.5 to 1.1 mm of water per cm for a sand, and 1.3 to 1.9 mm for a loam or a silt loam, according to the water contents published in FAO-564 (Table 1).
Over a real profile, TAW also depends on the depth the roots explore and on the stones: it is much lower as soon as a calcareous horizon or bedrock stops the roots close to the surface, or when stones are abundant. Two examples from France:
Boigneville (Essonne), Arvalis experimental farm. The TAW of a clay-limestone soil (French argilo-calcaire) whose top 40 cm lie on a highly calcareous horizon is around 55 mm of water; that of a neighbouring clay loam, where hard limestone appears only below 120 cm, is around 120 mm10.
Poitou-Charentes. The regional soil reference system uses 60 to 80 mm of water for shallow groie soils and 110 to 130 mm for deep groies, classes of that reference system11.
Table 1. Orders of magnitude of TAW according to textureShowHide
Horizon texture (USDA class)
mm of water per cm of soil
TAW over 30 cm (mm of water)
over 60 cm
over 90 cm
Sand
0.5–1.1
15–33
30–66
45–99
Sandy loam
1.1–1.5
33–45
66–90
99–135
Loam, silt loam
1.3–1.9
39–57
78–114
117–171
Clay
1.2–2.0
36–60
72–120
108–180
Horizon of uniform texture, without stones. Values calculated from the water contents at field capacity and at the wilting point published in FAO-56 (Table 19)4, whose US texture classification does not exactly match the triangle used in France. The Saxton and Rawls equations, which the hub uses, give 1.95 mm of water per cm for the typical composition of a silt loam (Table 2), slightly above the FAO range. Both are estimates from the texture class alone, with an error of around 0.5 mm per cm (see “Accuracy and limitations”).
The result is an order of magnitude, for four reasons.
A texture class covers a range of soils. For French soils, the root mean square error of an available water capacity estimated from the texture class alone is 0.047 to 0.058 cm³ of water per cm³ of soil, that is 0.47 to 0.58 mm of water per cm12. Over a 60 cm horizon, this represents around 30 mm of water. Within a single class of the Aisne triangle, the standard deviation of the available water capacity ranges from 0.15 to 0.50 mm of water per cm, because of differences in soil structure2.
Two definitions of field capacity coexist. Saxton and Rawls set it at a tension of 33 kPa1, the French references at 10 kPa (pF 2)2. For the same soil, the latter gives a higher field capacity, and therefore a larger available water capacity: for a sand, 0.49 mm of water per cm with the USDA classes, compared with 0.60 to 0.73 mm with the Aisne triangle (Tables 2 and 3).
Rooting depth matters as much as texture. In a uniform soil, TAW is proportional to it: using 80 cm instead of 60 cm increases it by a third.
Stones and compaction change the water held. The calculator accounts for stones according to their type, but not for compaction, which only a measurement captures.
Methods based on local measurements are the most precise3: water contents measured in the laboratory on each horizon, or monitoring soil moisture at several depths, which shows the water the crop actually uses.
The calculator uses only the values below and the formulas on this page: the same calculation can be done by hand.
Table 2. USDA texture classes: water contents and water heldShowHide
USDA texture class
Identifier
θ at field capacity (% vol.)
θ at wilting point (% vol.)
mm of water per cm
Sand
sand
9.9
5.0
0.49
Loamy sand
loamy-sand
13.2
6.8
0.63
Sandy loam
sandy-loam
18.7
9.2
0.95
Loam
loam
26.9
12.6
1.43
Silt loam
silt-loam
30.5
11.0
1.95
Silt
silt
31.1
5.8
2.53
Sandy clay loam
sandy-clay-loam
27.8
17.7
1.01
Clay loam
clay-loam
35.7
21.8
1.39
Silty clay loam
silty-clay-loam
37.9
21.0
1.69
Sandy clay
sandy-clay
37.7
26.6
1.11
Silty clay
silty-clay
41.6
27.7
1.39
Clay
clay
45.1
34.0
1.11
Water contents calculated with the equations of Saxton and Rawls1 for the typical composition of each class and 2.5% organic matter, at 33 kPa (field capacity) and 1,500 kPa (wilting point); these are the hub’s values. Loam is a texture balanced between sand, silt and clay; silt is a much finer texture.
Table 3. Classes of the French (Aisne) texture triangle: water held by the fine earthShowHide
Code
Aisne triangle class
Tilled horizon (A), mm of water per cm
Deeper horizons (E, B, C), mm of water per cm
ALO
Argile lourde
1.24
1.12
AL
Argile limoneuse
1.36
1.13
A
Argile
—
0.93
AS
Argile sableuse
1.73
0.95
LA
Limon argileux
1.73
1.49
LAS
Limon argilo-sableux
1.67
1.48
LSA
Limon sablo-argileux
1.43
1.27
LM
Limon moyen
2.13
2.07
LMS
Limon moyen sableux
1.83
1.96
LL
Limon léger
—
—
LLS
Limon léger sableux
—
—
LS
Limon sableux
1.62
—
SA
Sable argileux
1.28
1.03
SL
Sable limoneux
1.31
1.16
S
Sable
0.60
0.73
Values of Bruand, Duval and Cousin, established on non-calcareous or slightly calcareous horizons, between pF 2 and pF 4.22; a dash marks a class without a reference value. Class names are kept in French, for want of official English names.
Table 4. Water held by stones according to their typeShowHide
Table 5. Depletion fraction p and rooting depth of cropsShowHide
Crop
Identifier
Fraction p
Rooting depth (cm)
Source
Other crop
other
0.50
—
FAO-56 (commonly used fraction p)
Aerobic rice
aerobic-rice
0.35
50–100
FAO-56; fraction p: Pereira et al., 2021 (field crops)
Almond
almond
0.40
100–200
FAO-56
Apple
apple
0.50
100–200
FAO-56
Apricot
apricot
0.50
100–200
FAO-56
Artichoke
artichoke
0.45
60–90
Pereira et al., 2021 (vegetables)
Asparagus
asparagus
0.45
120–180
Pereira et al., 2021 (vegetables)
Aubergine
eggplant
0.45
40–100
Pereira et al., 2021 (vegetables)
Avocado
avocado
0.70
50–100
FAO-56
Beetroot
table-beet
0.45
60–100
Pereira et al., 2021 (vegetables)
Broccoli
broccoli
0.40
40–60
Pereira et al., 2021 (vegetables)
Brussels sprouts
brussels-sprouts
0.40
40–60
Pereira et al., 2021 (vegetables)
Bulb onion
bulb-onion
0.30
30–60
FAO-56
Cabbage
cabbage
0.40
30–50
Pereira et al., 2021 (vegetables)
Carrot
carrot
0.30
30–50
Pereira et al., 2021 (vegetables)
Castor bean
castor-bean
0.60
80–130
Pereira et al., 2021 (field crops)
Cauliflower
cauliflower
0.40
40–60
Pereira et al., 2021 (vegetables)
Cherry
cherry
0.50
100–200
FAO-56
Chickpea
chickpea
0.45
70–100
Pereira et al., 2021 (field crops)
Chilli pepper
chili-pepper
0.30
50–100
Pereira et al., 2021 (vegetables)
Clementine
clementine
0.50
120–150
FAO-56
Cotton
cotton
0.60
100–170
Pereira et al., 2021 (field crops)
Courgette
zucchini
0.50
60–110
Pereira et al., 2021 (vegetables)
Cowpea
cowpea
0.45
60–130
Pereira et al., 2021 (field crops)
Cucumber
cucumber
0.40
60–120
Pereira et al., 2021 (vegetables)
Dry bean
dry-bean
0.45
50–90
Pereira et al., 2021 (field crops)
Durum wheat
durum-wheat
0.55
100–150
Hub (no row in FAO-56)
Faba bean
faba-bean
0.45
50–70
Pereira et al., 2021 (field crops)
Field pea
field-pea
0.45
60–100
Pereira et al., 2021 (field crops)
Fig
fig
0.65
120–170
FAO-56, values for olive
Flax
flax
0.50
100–150
Pereira et al., 2021 (field crops)
Fodder beet
fodder-beet
0.55
70–120
Hub: values for sugar beet (Pereira et al., 2021); no source tabulates fodder beet
Forage sorghum
forage-sorghum
0.55
100–150
Pereira et al., 2021 (field crops)
French bean
green-bean
0.45
50–70
FAO-56
Garlic
garlic
0.30
30–50
Pereira et al., 2021 (vegetables)
Gold kiwifruit
gold-kiwifruit
0.35
70–130
FAO-56
Grain maize
grain-maize
0.50
60–150
Pereira et al., 2021 (field crops)
Grain sorghum
grain-sorghum
0.55
100–150
Pereira et al., 2021 (field crops)
Grapevine (table grape)
grapevine-table-grape
0.35
100–200
FAO-56
Grapevine (wine grape)
grapevine-wine-grape
0.45
100–200
FAO-56
Groundnut
groundnut
0.50
50–100
Pereira et al., 2021 (field crops)
Hazelnut
hazelnut
0.40
100–200
FAO-56, values for almond
Highbush blueberry
highbush-blueberry
0.50
60–120
FAO-56
Hop
hop
0.50
100–120
FAO-56
Lemon
lemon
0.50
120–150
FAO-56
Lentil
lentil
0.50
60–80
Pereira et al., 2021 (field crops)
Lettuce
lettuce
0.30
30–50
FAO-56
Lucerne (1st cut)
alfalfa-1st-cut
0.55
100–200
FAO-56
Melon
melon
0.40
60–120
Pereira et al., 2021 (vegetables)
Oats
oats
0.55
100–150
Pereira et al., 2021 (field crops)
Oilseed rape
oilseed-rape
0.50
80–130
Pereira et al., 2021 (field crops)
Olive
olive
0.65
120–170
FAO-56
Orange
orange
0.50
120–150
FAO-56
Parsnip
parsnip
0.40
50–100
Pereira et al., 2021 (vegetables)
Peach
peach
0.50
100–200
FAO-56
Pear
pear
0.50
100–200
FAO-56
Pearl millet
pearl-millet
0.55
100–200
Pereira et al., 2021 (field crops)
Perennial ryegrass (cutting)
perennial-ryegrass-cutting
0.60
60–100
FAO-56, “Rye Grass hay” row
Perennial ryegrass (grazing)
perennial-ryegrass
0.60
50–150
FAO-56, “Grazing Pasture — Rotated Grazing” row
Perennial ryegrass (turf)
perennial-ryegrass-turf
0.40
50–100
FAO-56, “Turf grass — cool season” row
Persimmon
persimmon
0.50
100–200
FAO-56, values for apple
Pistachio
pistachio
0.40
100–150
FAO-56
Plum
plum
0.50
100–200
FAO-56
Pomegranate
pomegranate
0.65
120–170
FAO-56, values for olive
Potato
potato
0.40
40–60
Pereira et al., 2021 (vegetables)
Radish
radish
0.30
30–50
Pereira et al., 2021 (vegetables)
Rye
rye
0.55
60–120
Pereira et al., 2021 (field crops)
Safflower
safflower
0.60
100–200
Pereira et al., 2021 (field crops)
Sesame
sesame
0.60
100–150
Pereira et al., 2021 (field crops)
Silage maize
silage-maize
0.50
60–150
Pereira et al., 2021 (field crops)
Soya bean
soybean
0.50
60–140
Pereira et al., 2021 (field crops)
Spinach
spinach
0.20
30–50
Pereira et al., 2021 (vegetables)
Spring wheat
spring-wheat
0.55
100–150
Pereira et al., 2021 (field crops)
Strawberry
strawberry
0.25
30–50
Pereira et al., 2021 (vegetables)
Sugar beet
sugar-beet
0.55
70–120
FAO-56
Sunflower
sunflower
0.45
80–200
Pereira et al., 2021 (field crops)
Sweet pepper
sweet-pepper
0.30
50–100
FAO-56
Sweet potato
sweet-potato
0.40
100–120
Pereira et al., 2021 (vegetables)
Sweetcorn
sweet-corn
0.50
60–150
Pereira et al., 2021 (field crops)
Temporary grassland
temporary-grassland
0.60
60–100
FAO-56
Tomato (open field)
tomato-open-field
0.40
60–120
Pereira et al., 2021 (vegetables)
Turnip
turnip
0.50
50–100
Pereira et al., 2021 (vegetables)
Walnut
walnut
0.50
170–240
FAO-56
Watermelon
watermelon
0.40
80–150
Pereira et al., 2021 (vegetables)
Winter barley
winter-barley
0.55
60–120
Pereira et al., 2021 (field crops)
Winter squash
winter-squash
0.40
90–150
Pereira et al., 2021 (vegetables)
Winter wheat
winter-wheat
0.55
100–150
Hub; FAO-56: 150–180
Values used by the hub: depletion fraction p valid for an ETc of 5 mm of water per day, and range of rooting depths. Depending on the crop, they come from Table 22 of FAO-564 or from its 2021 update by Pereira and colleagues, for field crops5 and for vegetables6. Hazelnut, fig, persimmon and pomegranate, absent from these tables, take the values of the tree shown. The calculator uses the lower value of the range, which FAO indicates may be used for irrigation scheduling4. For three crops, marked “Hub”, the hub uses values that depart from Table 22 of FAO-56, shown in the Source column, or that this table does not give.
Saxton and Rawls (2006) equations used for a particle-size analysisShowHide
S = sand (%) / 100 C = clay (%) / 100 OM = organic matter (%)
θ1500t = 0.031 - 0.024 S + 0.487 C + 0.006 OM + 0.005 S×OM - 0.013 C×OM + 0.068 S×C
The hub performs the same calculation for each probe, and compares it with the measurement. In the probe settings, the soil texture is declared at each measurement depth, as a USDA class or from a particle-size analysis, organic matter included; the hub derives the water held with the equations of Saxton and Rawls. The declared crop sets the depletion fraction p and the rooting depth, with the same values as in this calculator, and a cap can limit this depth when an obstacle stops the roots higher up.
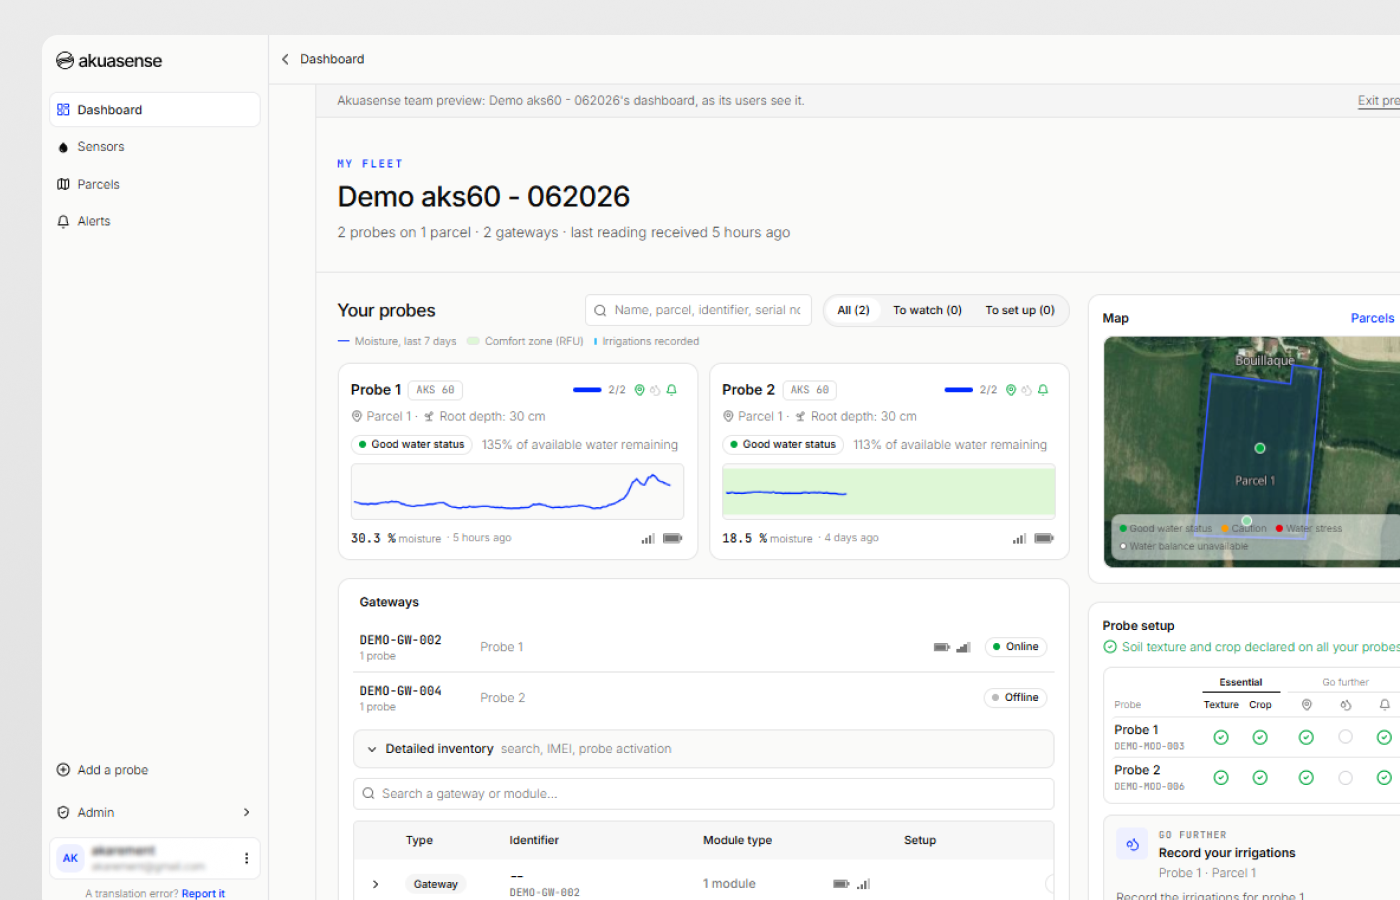
The hub then calculates TAW and RAW for the root zone (“Total reserve” and “Readily available” in its interface) and, from the soil moisture measured every hour at each depth, the root zone depletion, the share of available water remaining and the water status of the probe.
The calculator on this page goes further on four points:
stones, according to their type;
the Aisne triangle references;
laboratory measurements;
RAW during a heatwave.
Measurement shows what calculation can only estimate:
Saxton K.E., Rawls W.J. (2006). Soil water characteristic estimates by texture and organic matter for hydrologic solutions. Soil Science Society of America Journal, 70(5), 1569-1578. doi:10.2136/sssaj2005.0117
Bruand A., Duval O., Cousin I. (2004). Estimation des propriétés de rétention en eau des sols à partir de la base de données SOLHYDRO : une première proposition combinant le type d'horizon, sa texture et sa densité apparente [Estimating soil water retention properties from the SOLHYDRO database: a first proposal combining the type of horizon, its texture and its bulk density]. Étude et Gestion des Sols, 11(3), 323-332. afes.fr
Bouthier A., Scheurer O., Seger M., Lagacherie P., Beaudoin N., Deschamps T., Sauter J., Fort J.-L., Cousin I. (2022). Réservoir en eau du sol utilisable par les cultures. Guide d'estimation. [Soil water reservoir available to crops: an estimation guide]. Éditions Arvalis, Paris. sols-et-territoires.org
Allen R.G., Pereira L.S., Raes D., Smith M. (1998). Crop evapotranspiration. Guidelines for computing crop water requirements. FAO Irrigation and Drainage Paper 56, Rome. Chapters 7 and 8 (Tables 19, 20 and 22; Equations 82 to 84). fao.org
Pereira L.S., Paredes P., Hunsaker D.J., López-Urrea R., Mohammadi Shad Z. (2021). Standard single and basal crop coefficients for field crops. Updates and advances to the FAO56 crop water requirements method. Agricultural Water Management, 243, 106466. doi:10.1016/j.agwat.2020.106466
Pereira L.S., Paredes P., López-Urrea R., Hunsaker D.J., Mota M., Mohammadi Shad Z. (2021). Standard single and basal crop coefficients for vegetable crops, an update of FAO56 crop water requirements approach. Agricultural Water Management, 243, 106196. doi:10.1016/j.agwat.2020.106196
Agriculture Victoria (2025). “Determining readily available water”, fact sheet, updated 22 September 2026. agriculture.vic.gov.au
Tetegan M., Nicoullaud B., Baize D., Bouthier A., Cousin I. (2011). The contribution of rock fragments to the available water content of stony soils: proposition of new pedotransfer functions. Geoderma, 165(1), 40-49. doi:10.1016/j.geoderma.2011.07.001
Arvalis (2026). “Maïs grain : comment gérer la conduite de parcelles suite à la canicule” [Grain maize: managing fields after the heatwave]. Terre-net, 3 August 2026. terre-net.fr
Arvalis. “Carte des sols – Ferme de Boigneville” [Soil map of the Boigneville farm], based on Bétrémieux R., Darthout R. (1968), Étude des sols du domaine de Boigneville [Soil survey of the Boigneville farm], INRA. ecophytopic.fr
Chambre régionale d'agriculture de Poitou-Charentes, IAAT (c. 2009). Inventaire, gestion et conservation des sols (IGCS) de Poitou-Charentes : unités de sols et objectifs de rendement [Soil inventory, management and conservation (IGCS) in Poitou-Charentes: soil units and yield targets]. Gis Sol. gissol.hub.inrae.fr
Roman Dobarco M., Cousin I., Le Bas C., Martin M. (2019). Pedotransfer functions for predicting available water capacity in French soils, their applicability domain and associated uncertainty. Geoderma, 336, 81-95. doi:10.1016/j.geoderma.2018.08.022
This calculator comes from the article Should you refill the soil’s available water before summer?, which offers three other tools: an irrigation capacity calculator, a wetted depth calculator and a seasonal soil water balance simulator.


 Akuasense